 SiloSentry
Watch the installed equipment.
Choose the class, site or tag cohort, preview its members and set the offline condition. Sam can check how far a problem extends before treating one report as a fleet outage.
SiloSentry makes grain-level monitors. The same small team develops the product, gets it working at customer sites and picks up the phone when a reading looks wrong.
Follow one monitor through their work. See where Dataplicity helps the team carry more of the job.
Follow the first installationAlex is preparing the monitor for Ashton Mill. A new sensor revision has changed the interface, and the installation date is approaching.
Alex brings the exact board revision, sensor datasheet and interface drawing to Equidna, Dataplicity’s AI hardware and firmware specialist. The discussion can work through the Linux interface, permissions and a test plan.
Alex records the revision B interface decision and bench-check plan in the shared North Silo folder. Sam has the baseline before the site visit; the team conversation explains which version to use and what still needs testing.
Sam can prepare the installation without asking Alex to reconstruct the decision.
Illustrative engineering brief
“Here is the sensor datasheet and revision B drawing. Help us check the interface to our Linux controller, decide how to detect a failed reading, and plan the bench tests.”
Alex uses the current Applications workspace: Data for the Silo and strapping-table business objects, Customer app for reusable pages, Automations for alerts and actions, and Test & publish for the version customers run. The application converts measured height in millimetres into the mill’s calibrated volume in m³.
SiloSentry owns the sensor choice, calibration, signal conversion, firmware and local safeguards. AI guidance supports the engineering work. The team explicitly supplies conversation context; storing a file or linking a board does not automatically give a specialist access to it. Shared specialist advice is read-only. Plan and usage limits apply.
Check the assistance workflowSam installs SS-AM-01 at North Silo. The mill’s network is different from the workshop’s, and Alex is back at the bench.
Sam connects the supported Linux monitor using the Dataplicity agent, checks its identity and assigns it to Ashton Mill. The team verifies a sensor reading through to the customer view.
In the customer portal, Sam opens Edit to bind SS-AM-01 and set its thresholds. The saved settings stay readable on the page. Manage calibration opens the saved curve and points in a modal. Sam can upload a CSV, drop a file or paste spreadsheet rows, then review the complete replacement before saving the table together. Cancel leaves the saved values unchanged.
Sam adds the calibration table and commissioning context to the same North Silo folder as Alex’s interface review. The support record keeps completed software checks separate from the physical checks still required on site.
The next person has the unit, the site information and a clear record of what was checked.
Illustrative installation record
Use SS-AM-01 when calling support. The shared folder carries the revision B baseline, calibration and investigation. Add physical inspection results when they are available.
The agent needs supported Linux and outbound connectivity. Sam uses the existing installation route to put it on the device and tests the actual site network. Product readings need a sensor/application integration and validated calculations. Files and planning boards support the team’s handover; they do not perform physical commissioning.
Build and connect a level monitorJo prepares Ashton Mill’s customer application. The mill needs to plan grain movements and spot readings that need attention.
SiloSentry configures its product readings, permitted settings and branded Customer Portal. Jo assigns the mill’s equipment and tests that its users can see only the sites and actions intended for them.
The operator can check the volume history and low-level condition directly. They can see when a reading is out of date and have a specific monitor to name when they need help.
Routine questions have a useful first stop, and engineering access stays with SiloSentry’s team.
Your grain store
Wheat · Monitor SS-AM-01
68.2 m³
120 m³ capacitySample reading · 09:42Illustrative customer view. These controls change sample data on this page only.
The team integrates the level stream, validates silo geometry and calibration, and configures the customer interface and roles. The readings shown here are illustrative volumes. The example does not forecast deliveries or place replenishment orders. Customer Portal availability and branding follow plan limits; granting customer access does not grant a terminal or unrestricted engineering controls.
SiloSentry product contract and handover guideThe mill calls about North Silo. In this worked scenario, the monitor is online, but its last sensor reading is ten minutes old.
Sam needs to know whether this is one sensor, one site or a wider problem. Fleet monitors watch a selected group of devices for connectivity loss. The product’s freshness alert answers the separate question: are new readings arriving? Here, SS-AM-01 is connected and South Silo is reporting, so the investigation starts with North Silo’s sensor data.
Choose the class, site or tag cohort, preview its members and set the offline condition. Sam can check how far a problem extends before treating one report as a fleet outage.
When the problem needs a managed response, open an incident. Sam acknowledges it, records the checks and keeps ownership through recovery. Configured on-call paths can escalate work that nobody has acknowledged.
Jo reviews the customer-facing wording and selects the status page. Customers can follow the impact, current action and recovery update while the team keeps working.
This worked incident is opened manually. Fleet connectivity monitors create alerts; service, heartbeat and user-impact monitoring can feed configured incident automation. The example does not imply that every sensor alert automatically pages someone or publishes a status update.
Sam checks SS-AM-01 and the reading timestamp. The gateway is connected. Its last 68.2 m³ is a stale observation, not evidence that the silo is empty. The second silo is still reporting.
In a field installation, Sam would follow the sensor runbook, inspect the available logs and use authorised remote access where appropriate. In this reference run, the simulator resumes reporting so the team can exercise the recovery path.
A fresh 68.2 m³ reading appears and the stale-reading alert clears. The monitor is connected and the customer view is live again. Physical sensor checks still belong to commissioning and the equipment maker’s support procedure.
Sam opens the SS-AM-01 team conversation with the symptom and checks already completed, linking the shared installation folder. Alex picks up from the revision B review, calibration table and commissioning record. Jo can follow the investigation and give the mill a precise update.
The next person can pick up the job without starting the investigation again.
Illustrative support handover
“SS-AM-01 stayed connected while its sensor report aged. Reproduced the stale-reading state, resumed the simulated reports and checked the fresh reading and alert recovery. A real installation would still need the sensor and service investigation recorded here.”
“Fresh readings are visible again and the software recovery checks passed. Alex owns the startup investigation; Sam owns the commissioning follow-up.”
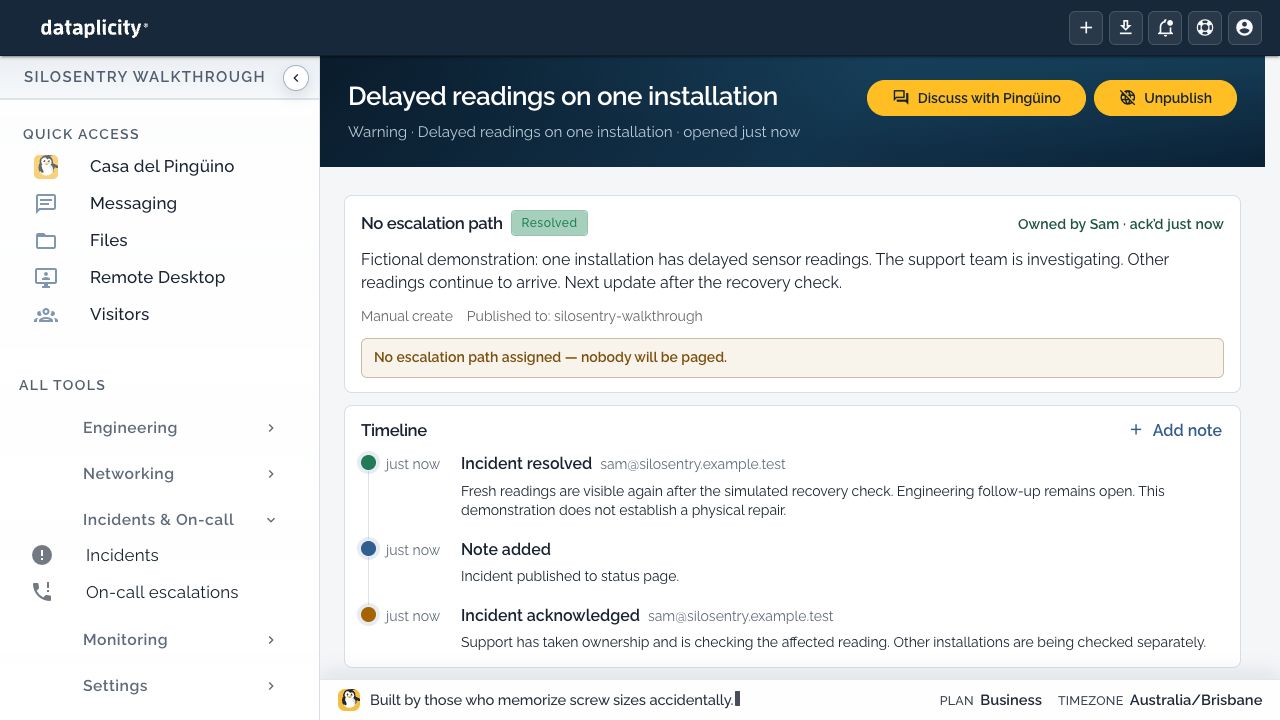
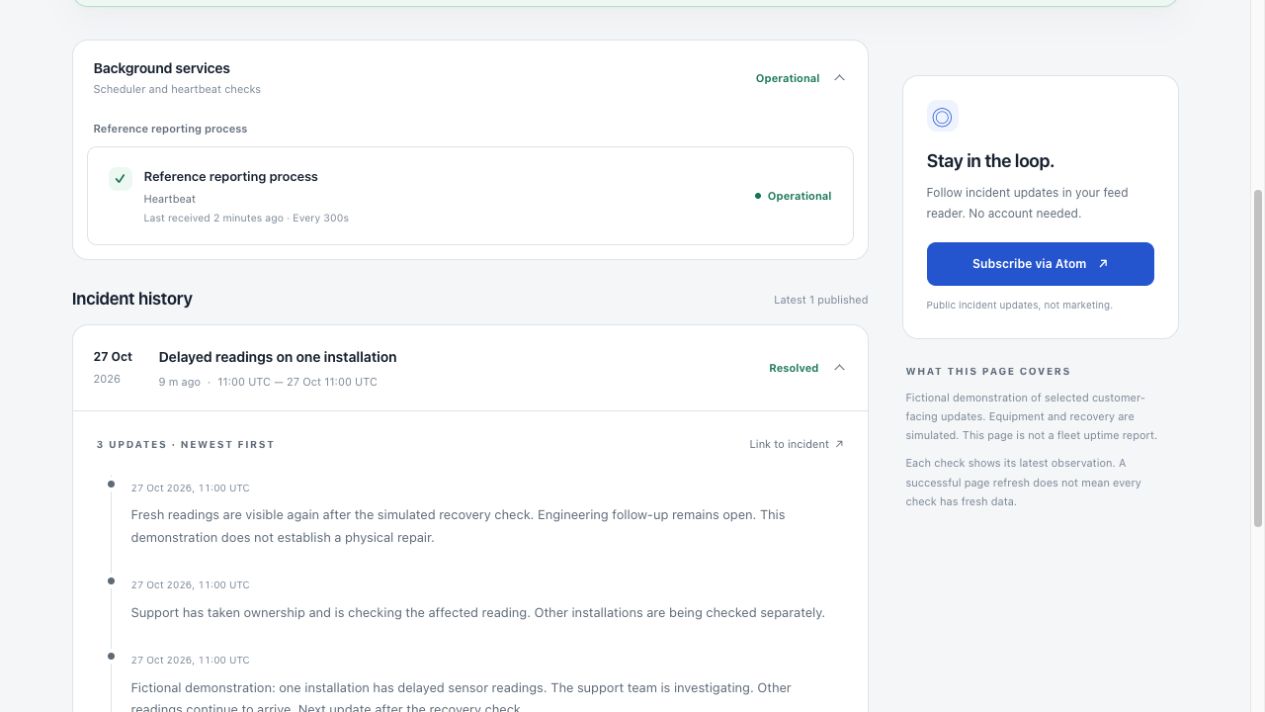
Monitoring, incident response, status pages, files and team discussion are parts of the same job. Handle them in Dataplicity, with fewer separate services to buy, connect and keep in step.
Configure the scopes, response policy and customer communication for your product. Availability and limits follow your Dataplicity plan.
Logs must have been collected before they can be reviewed. Live terminal and device-service access require an online device and authorised access. An offline device can still need a local visit. AI access depends on the conversation and its permissions; a specialist invited to team chat does not automatically have device authority.
Check the full support workflowAlex finds that the sensor service needs to wait for its interface to become ready at startup. The fix needs testing while Sam keeps the existing installations supported.
Alex adds readiness handling to SiloSentry’s sensor software, then tests a normal boot, a delayed interface and a missing sensor on bench hardware. The team releases to a limited set of suitable monitors and reviews their individual outcomes before expanding.
Sam updates the installation checks with the startup test. Jo can explain the change to Ashton Mill, and the board carries the remaining rollout work.
A field problem can lead to a reviewed product improvement and a better handover next time.
Check real signals, missing data and restart behaviour on representative hardware.
Choose suitable devices and review their individual outcomes.
Expand deliberately and update the notes the next installer will use.
Software delivery requires a supported, prepared runtime and a tested release process. RAUC image updates additionally require qualified images, signing, boot and recovery behaviour. An agent installation alone does not provide those. Fleet jobs and application releases serve different jobs; a successful command alone does not establish product recovery.
Choose an adoption path for existing equipmentThe installation record and the conversation belong with the team, so the next answer does not depend on Alex being available.
In Files, Ashton Mill → North Silo – SS-AM-01 holds the revision B interface review, the calibration table and Sam’s commissioning and support record. The same record carries the symptom, completed checks, recovery result and next owners.
Alex keeps the engineering baseline here. Sam adds the site and support context. Jo can read what was verified before speaking to the customer.
Read the example handover record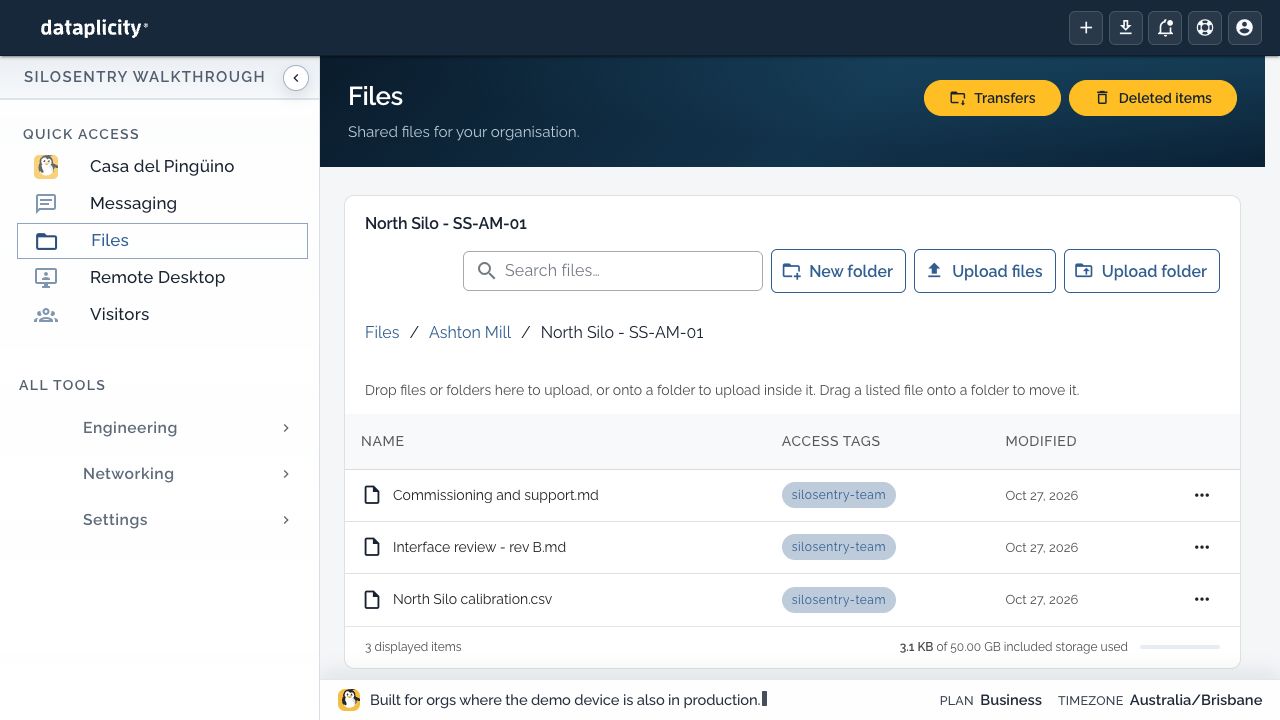
Sam names SS-AM-01, links the folder and records what is known. Alex takes the startup-readiness investigation. Sam keeps the commissioning follow-up. Jo has the result and the remaining work, without chasing three separate accounts of the problem.
Files hold the reference material. Chat holds the discussion, decisions and handover between the people doing the work.
The team can invite an AI specialist with selected context when useful. This example conversation is between Alex, Sam and Jo; it does not imply automatic file access or device authority.
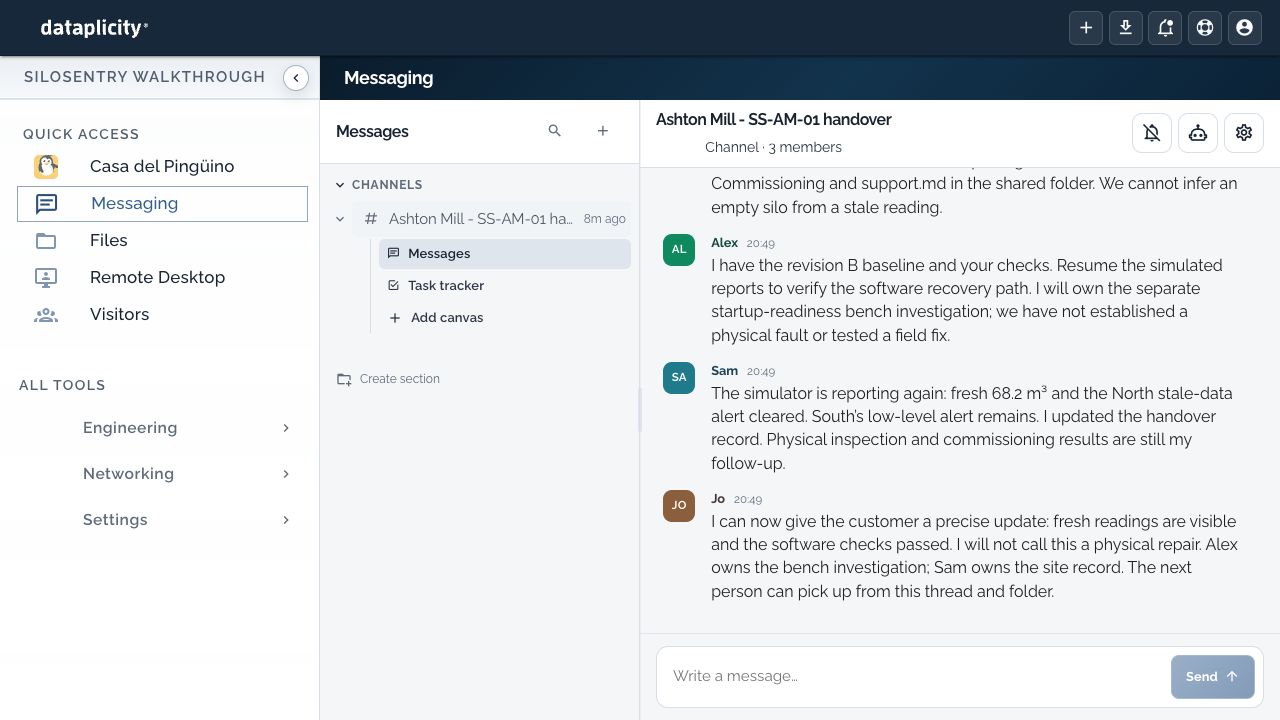
These are internal SiloSentry team records. The mill’s customer portal remains focused on its equipment; portal access does not grant access to this folder or conversation. The records and messages are authored demonstration content in an isolated local organisation. The recovery uses simulated equipment.
One application, the same Ashton Mill silos, and the current engineering and customer screens. Open a capture to inspect it.
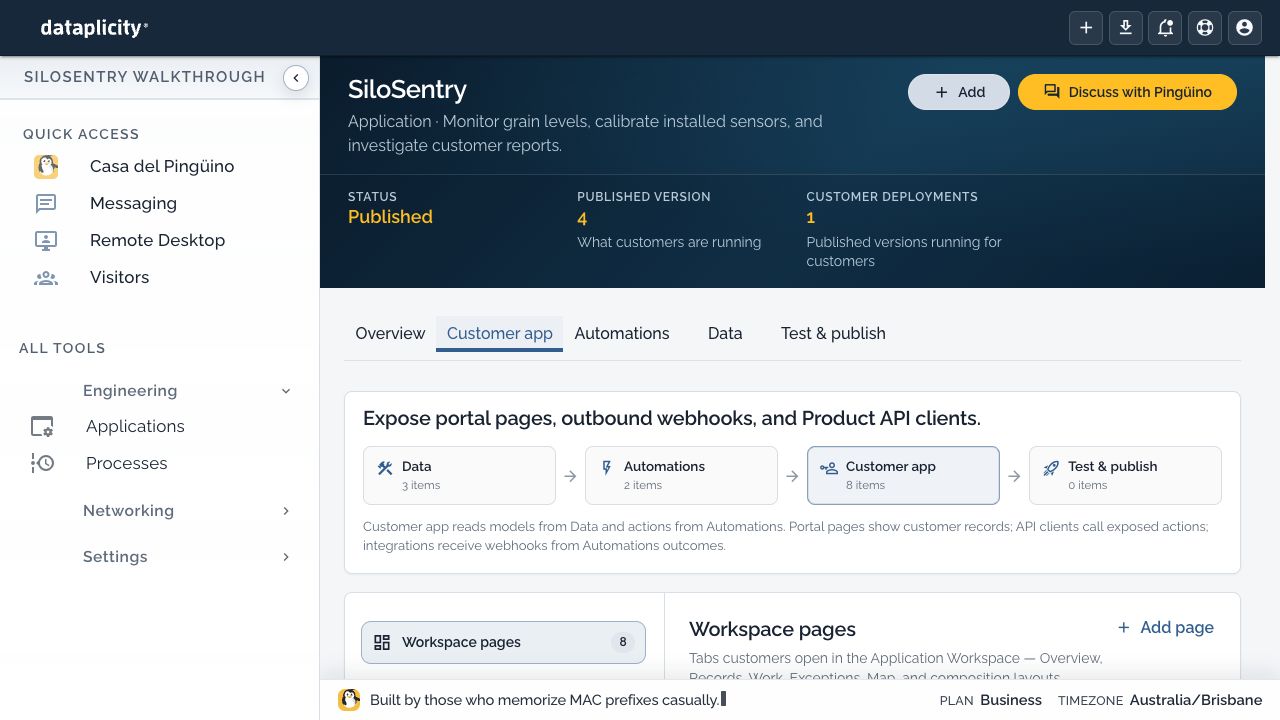
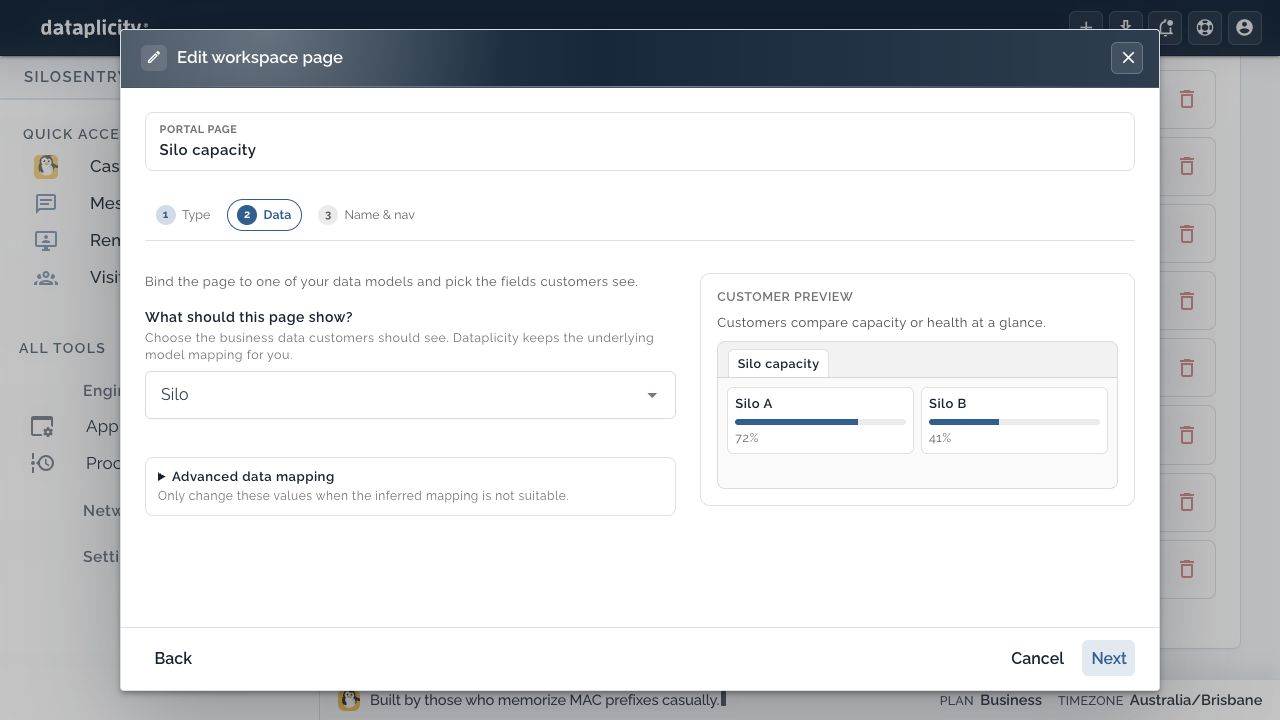
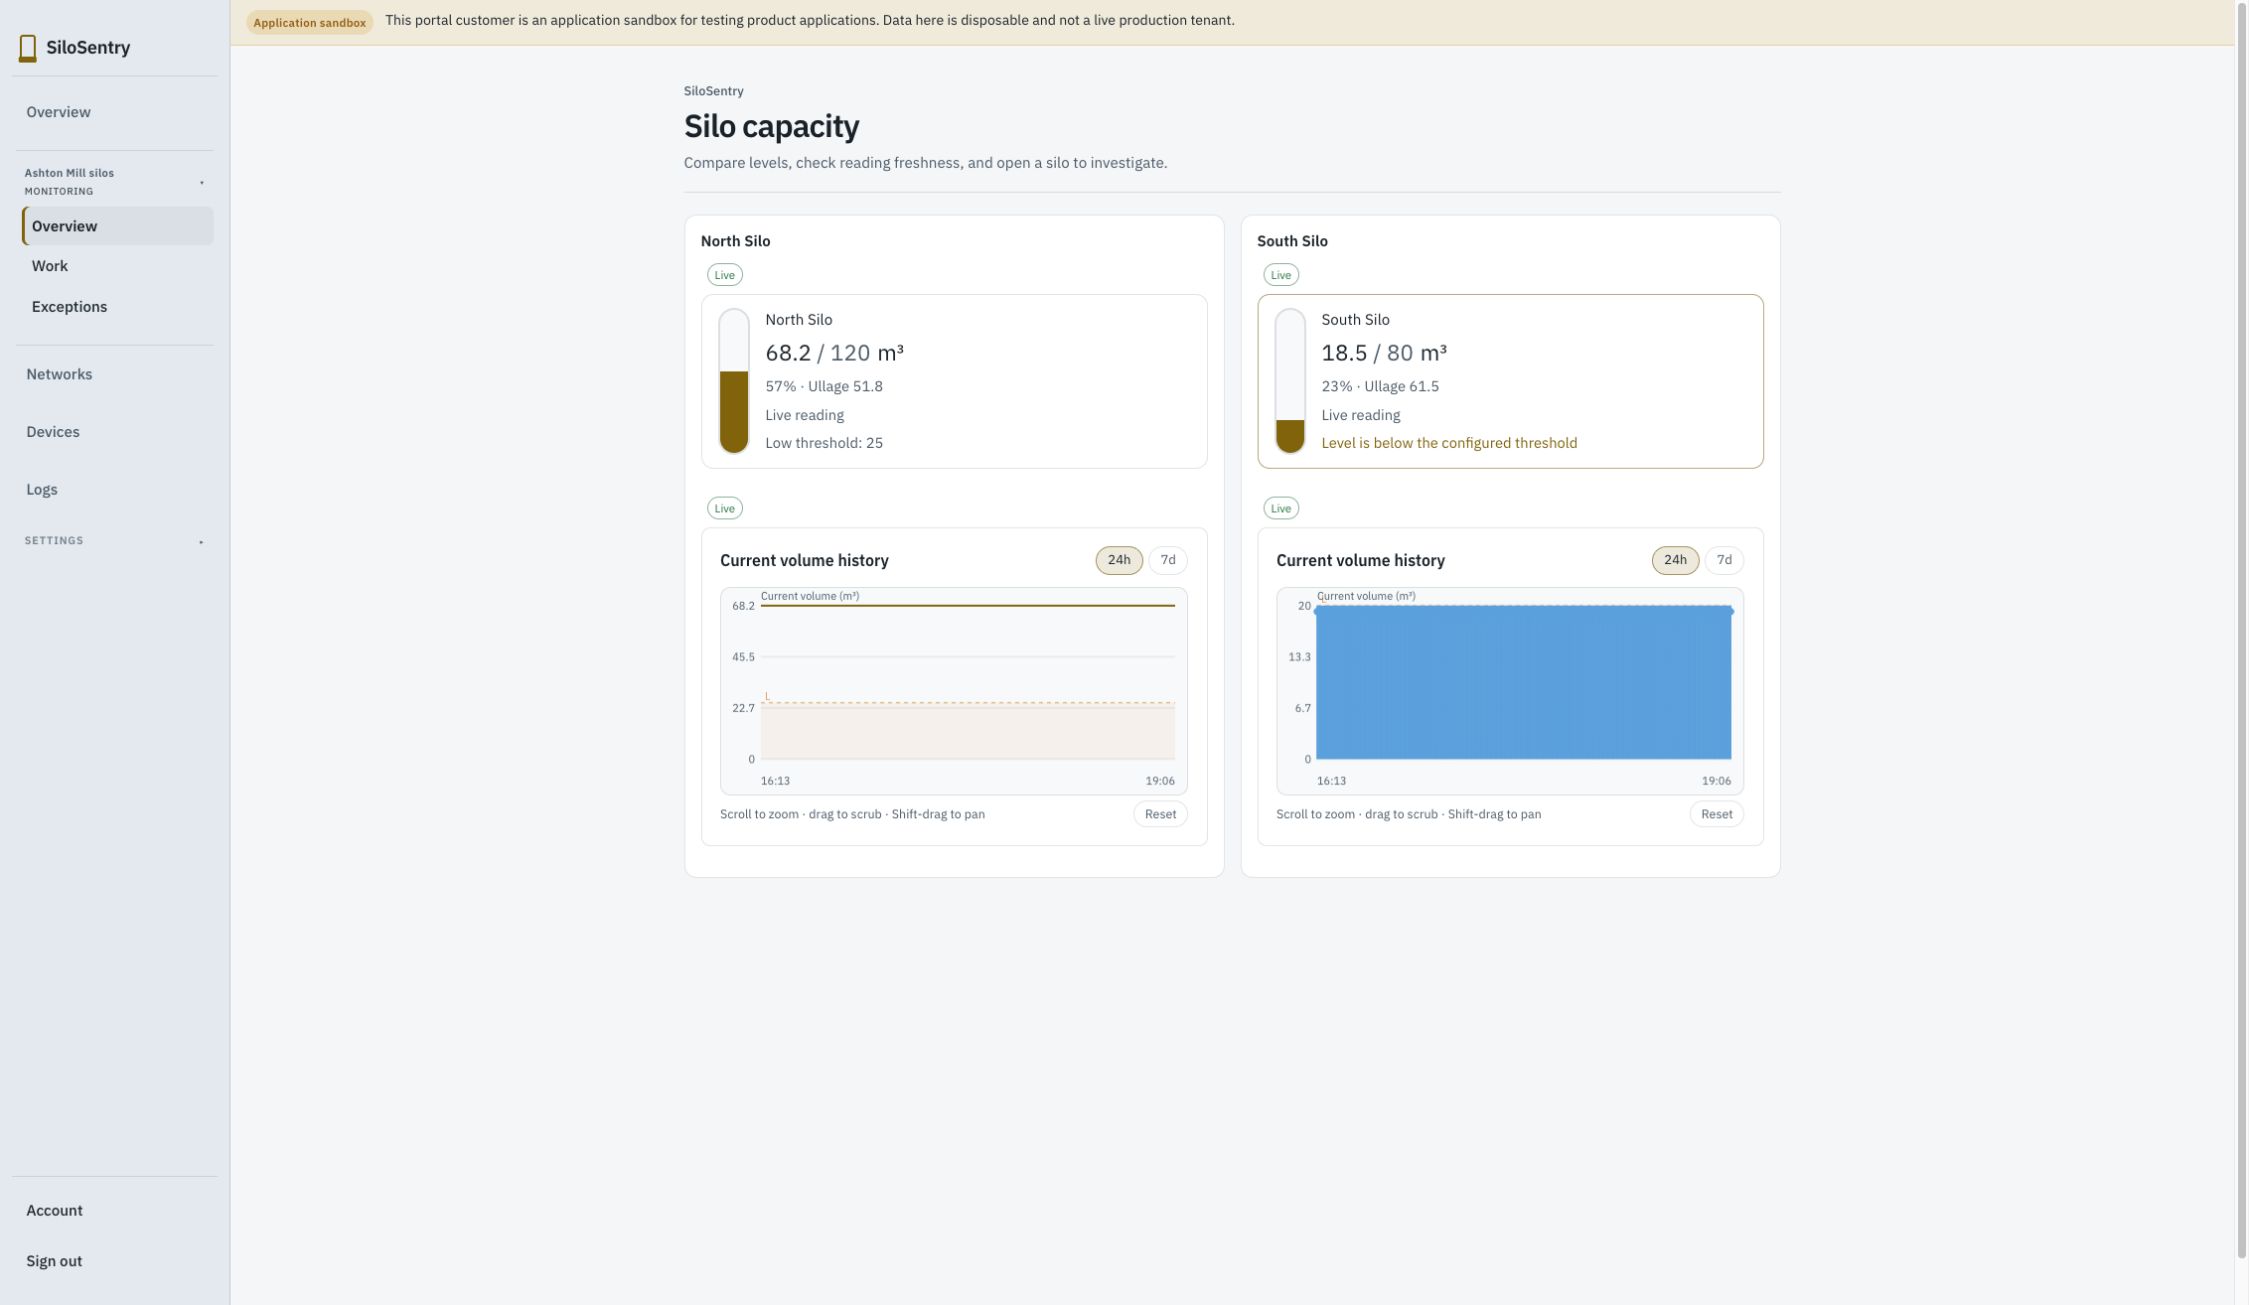
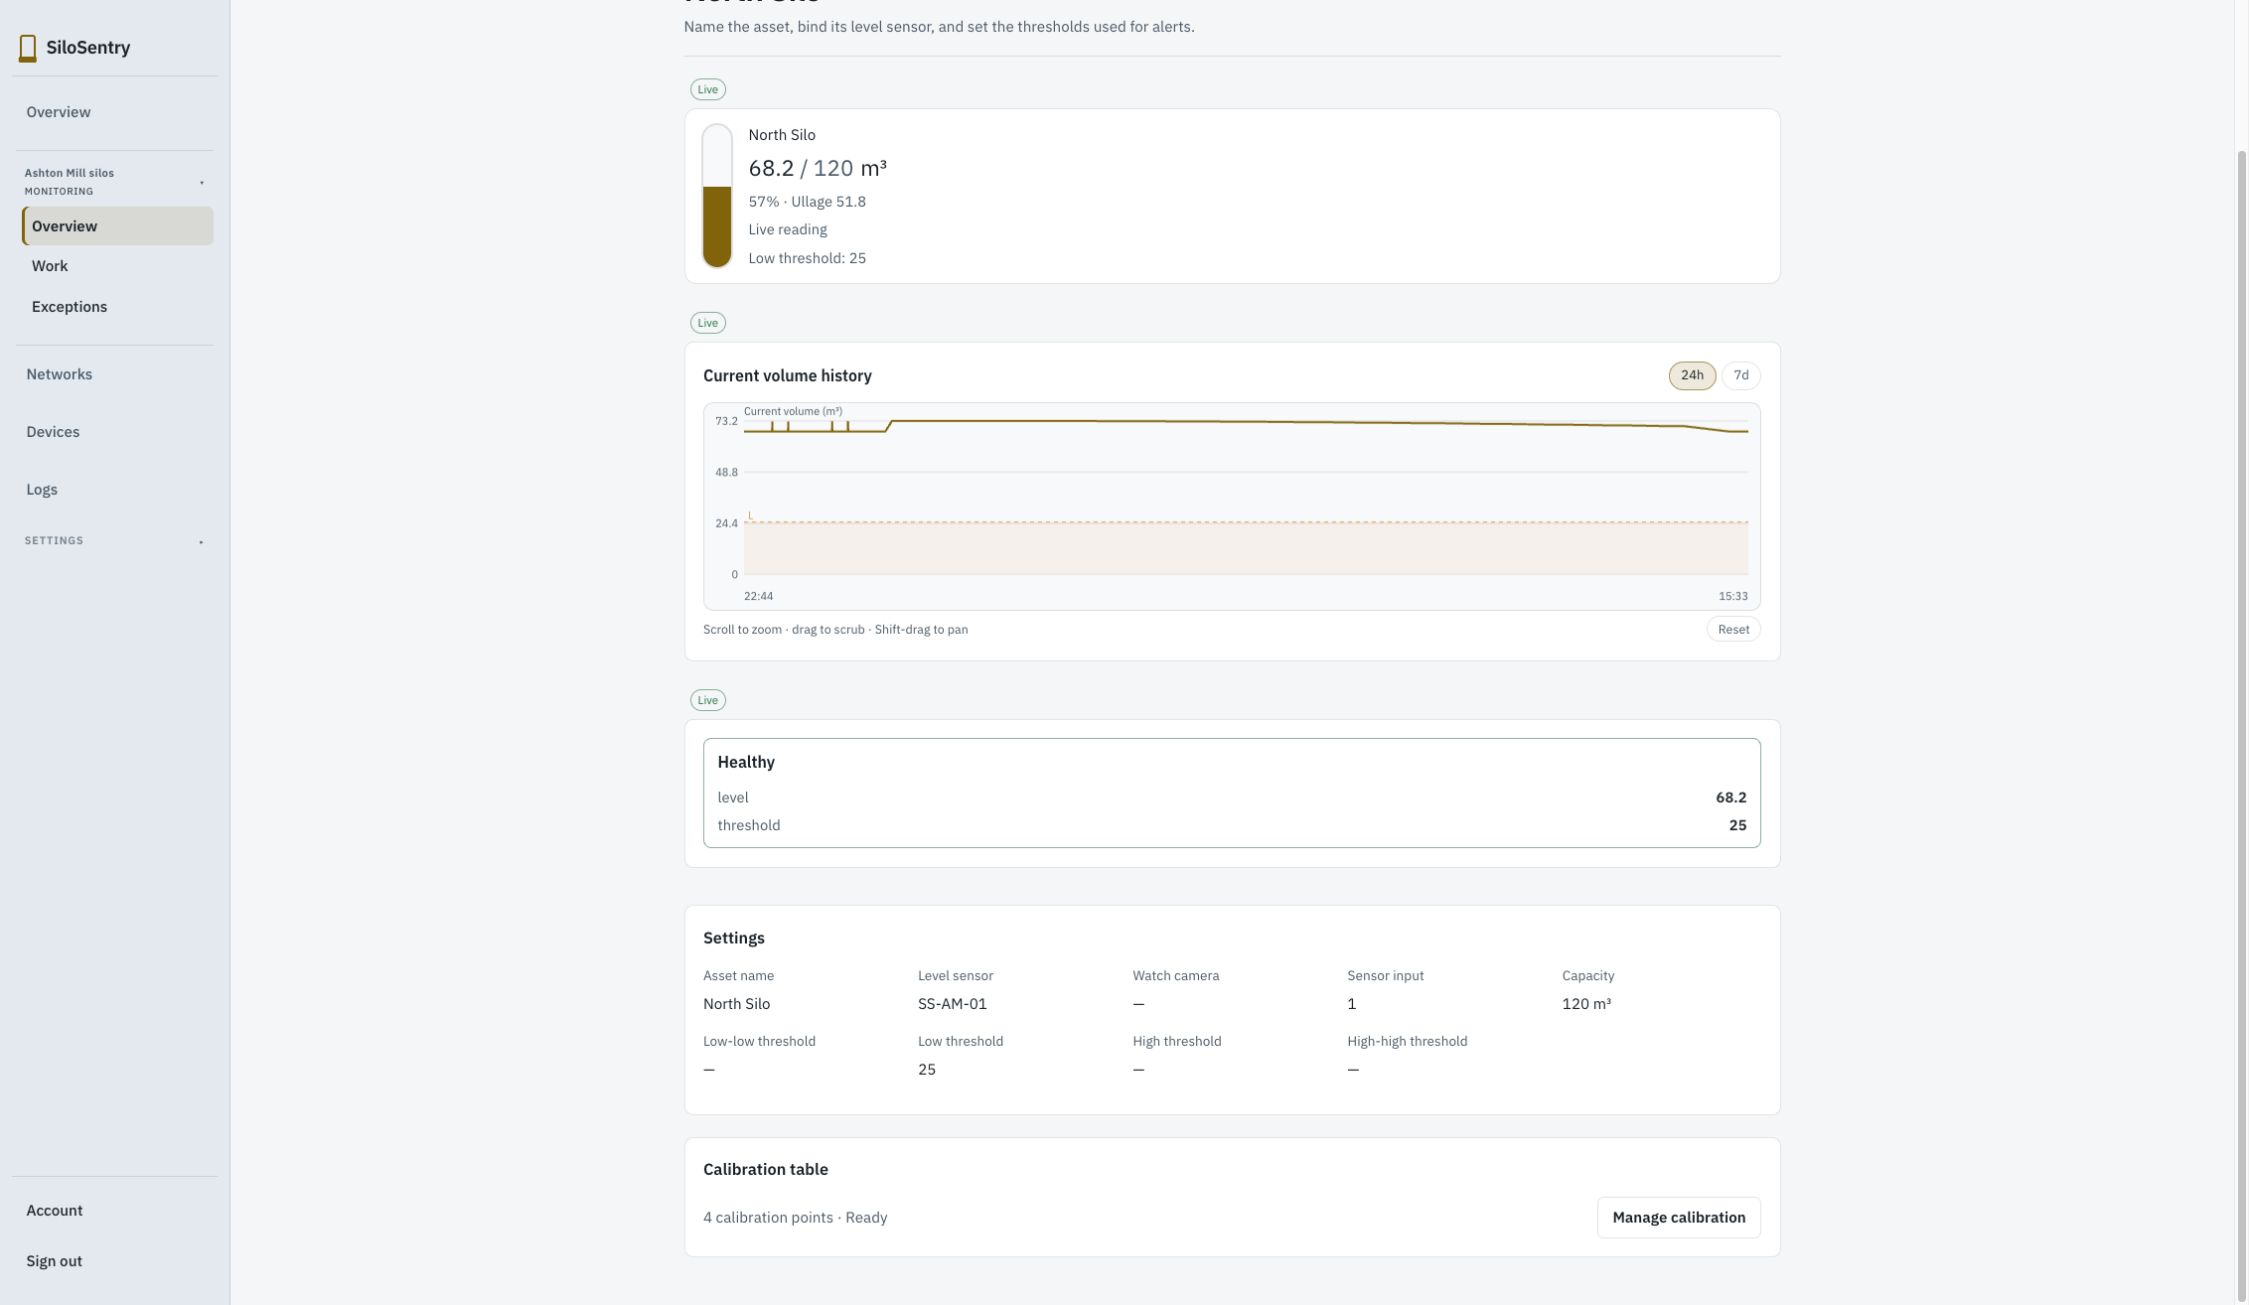
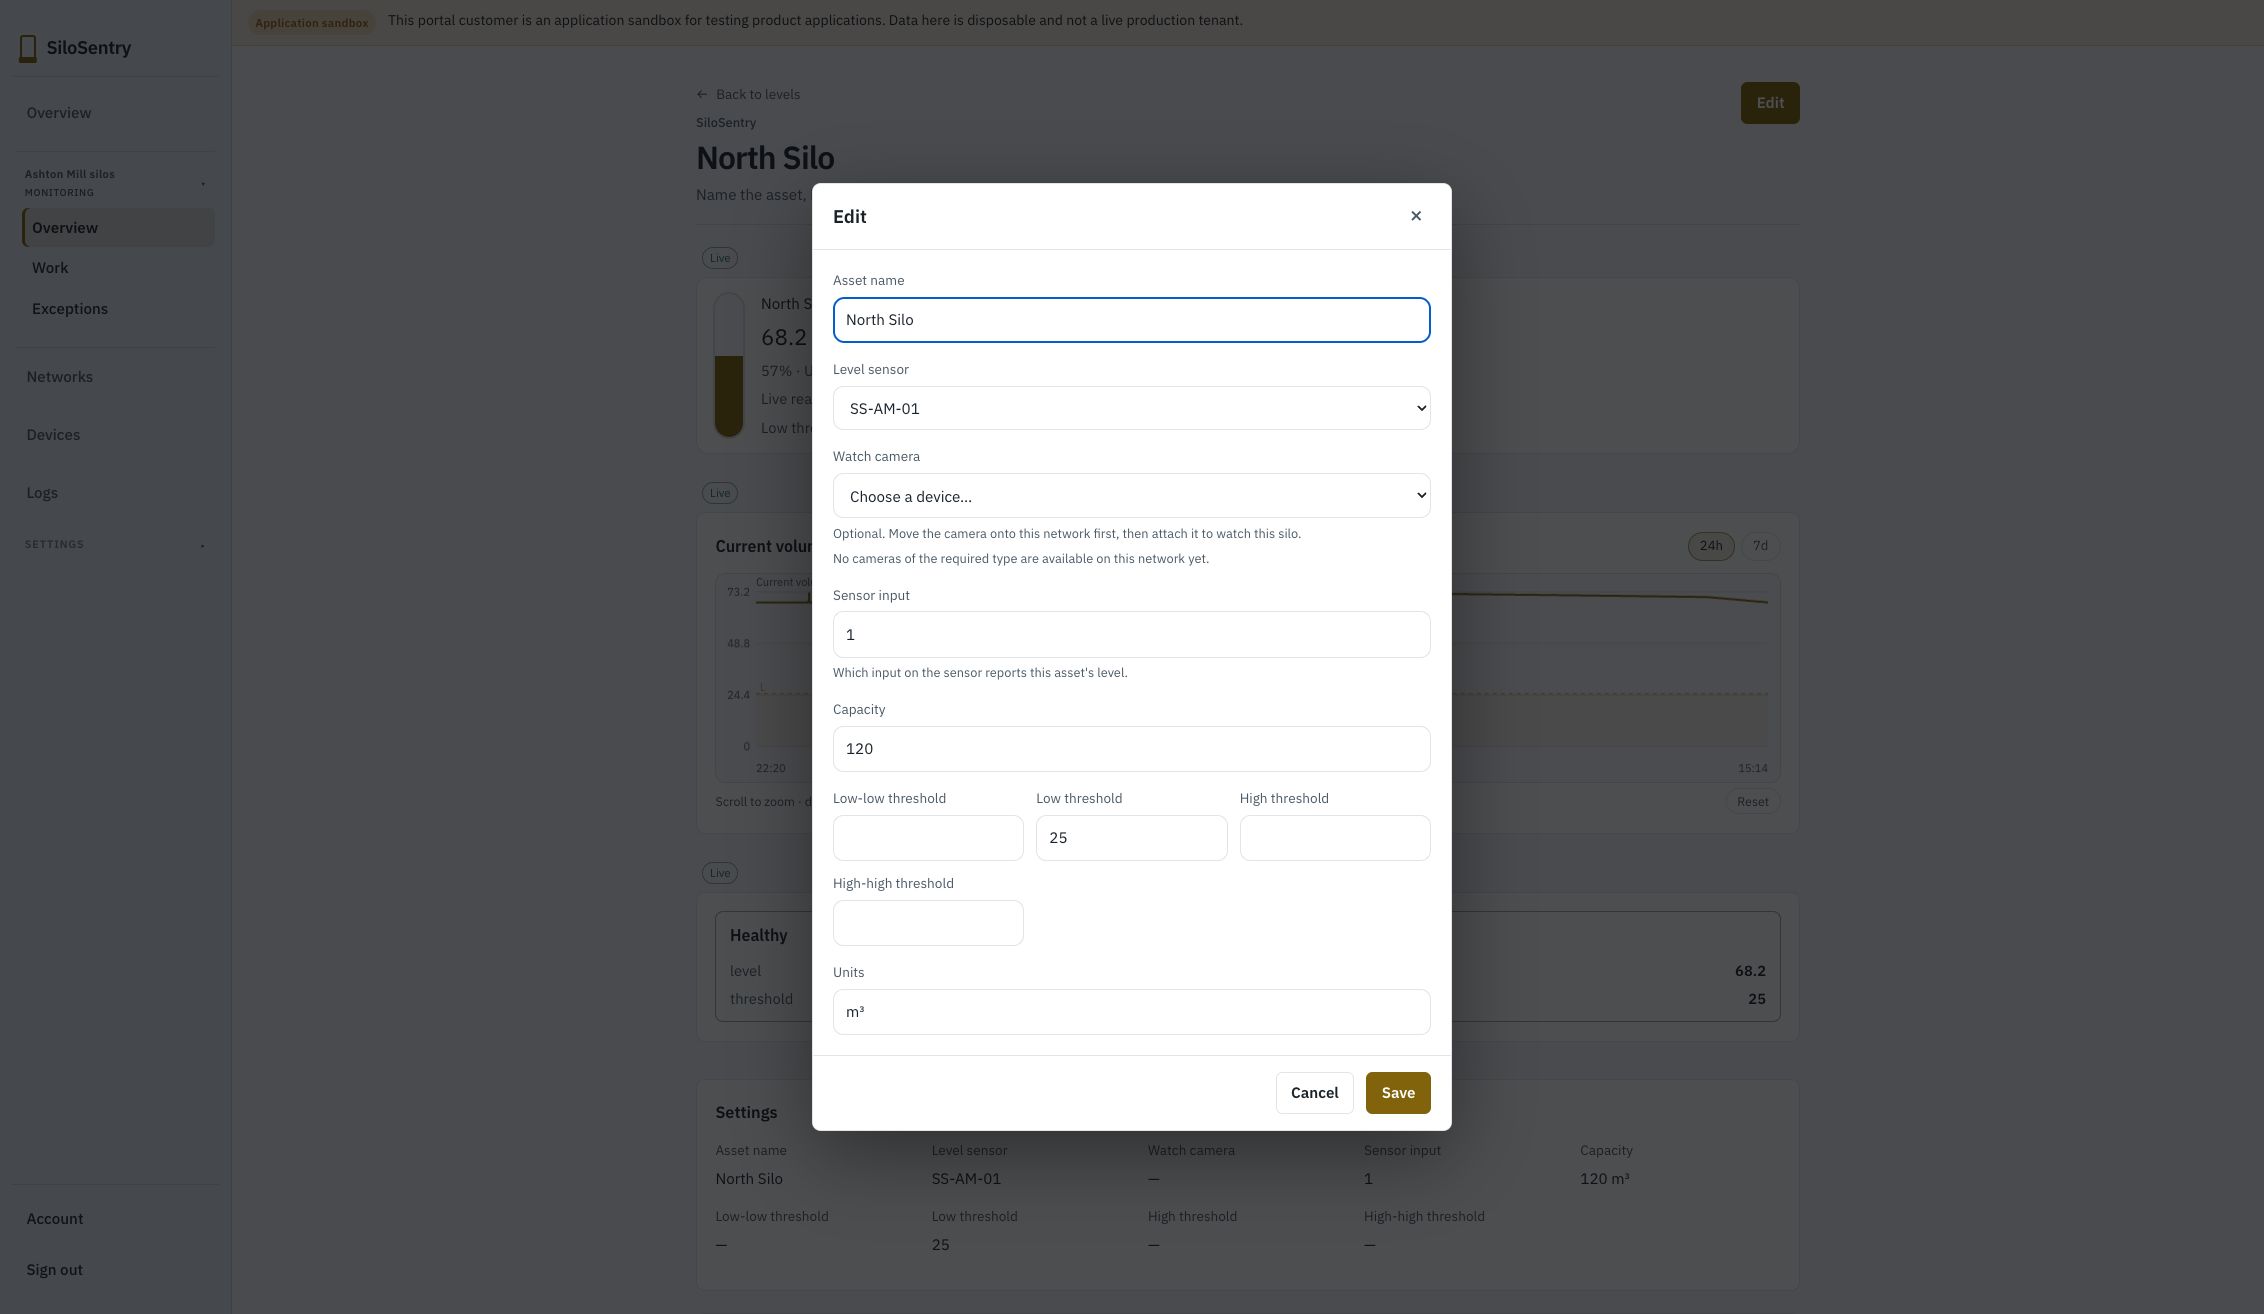
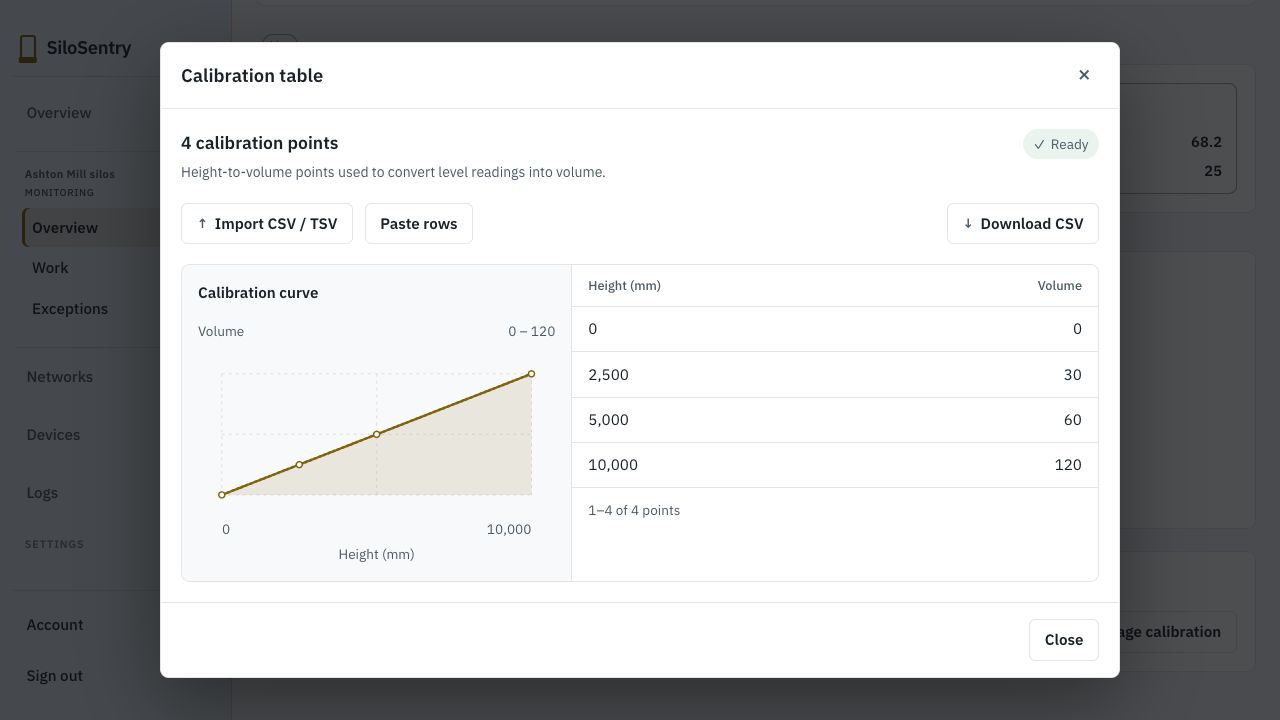
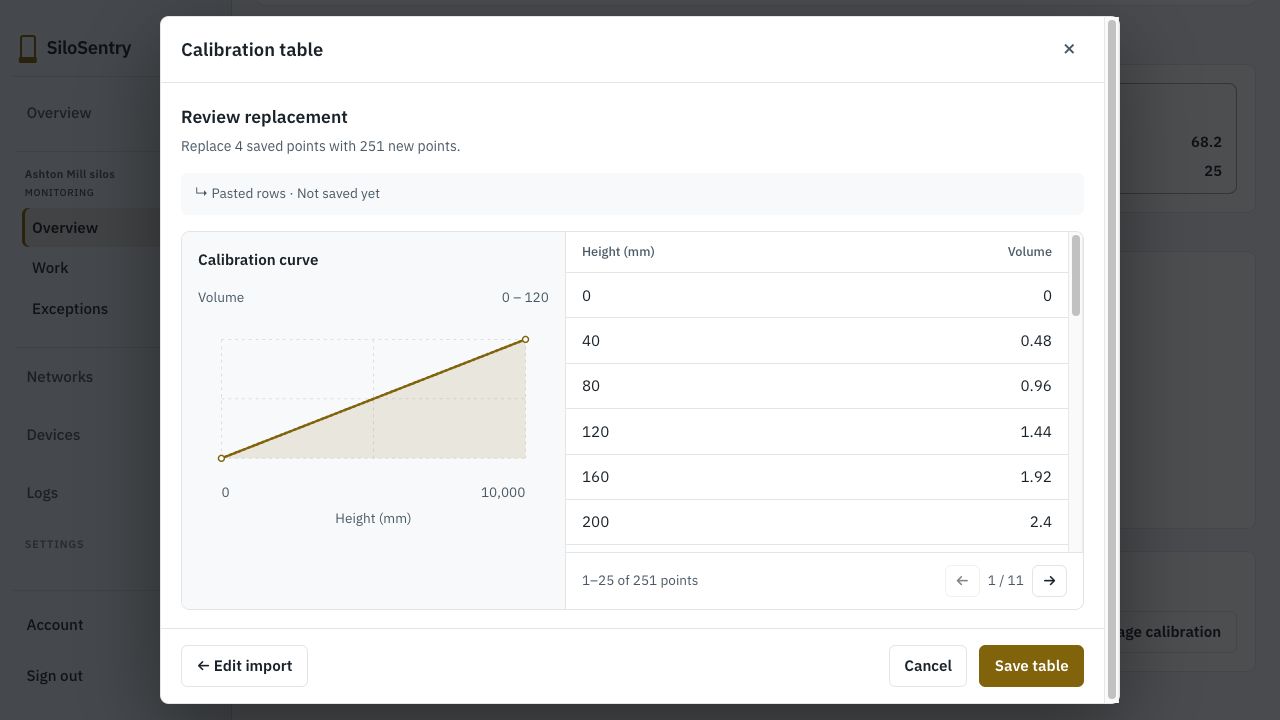
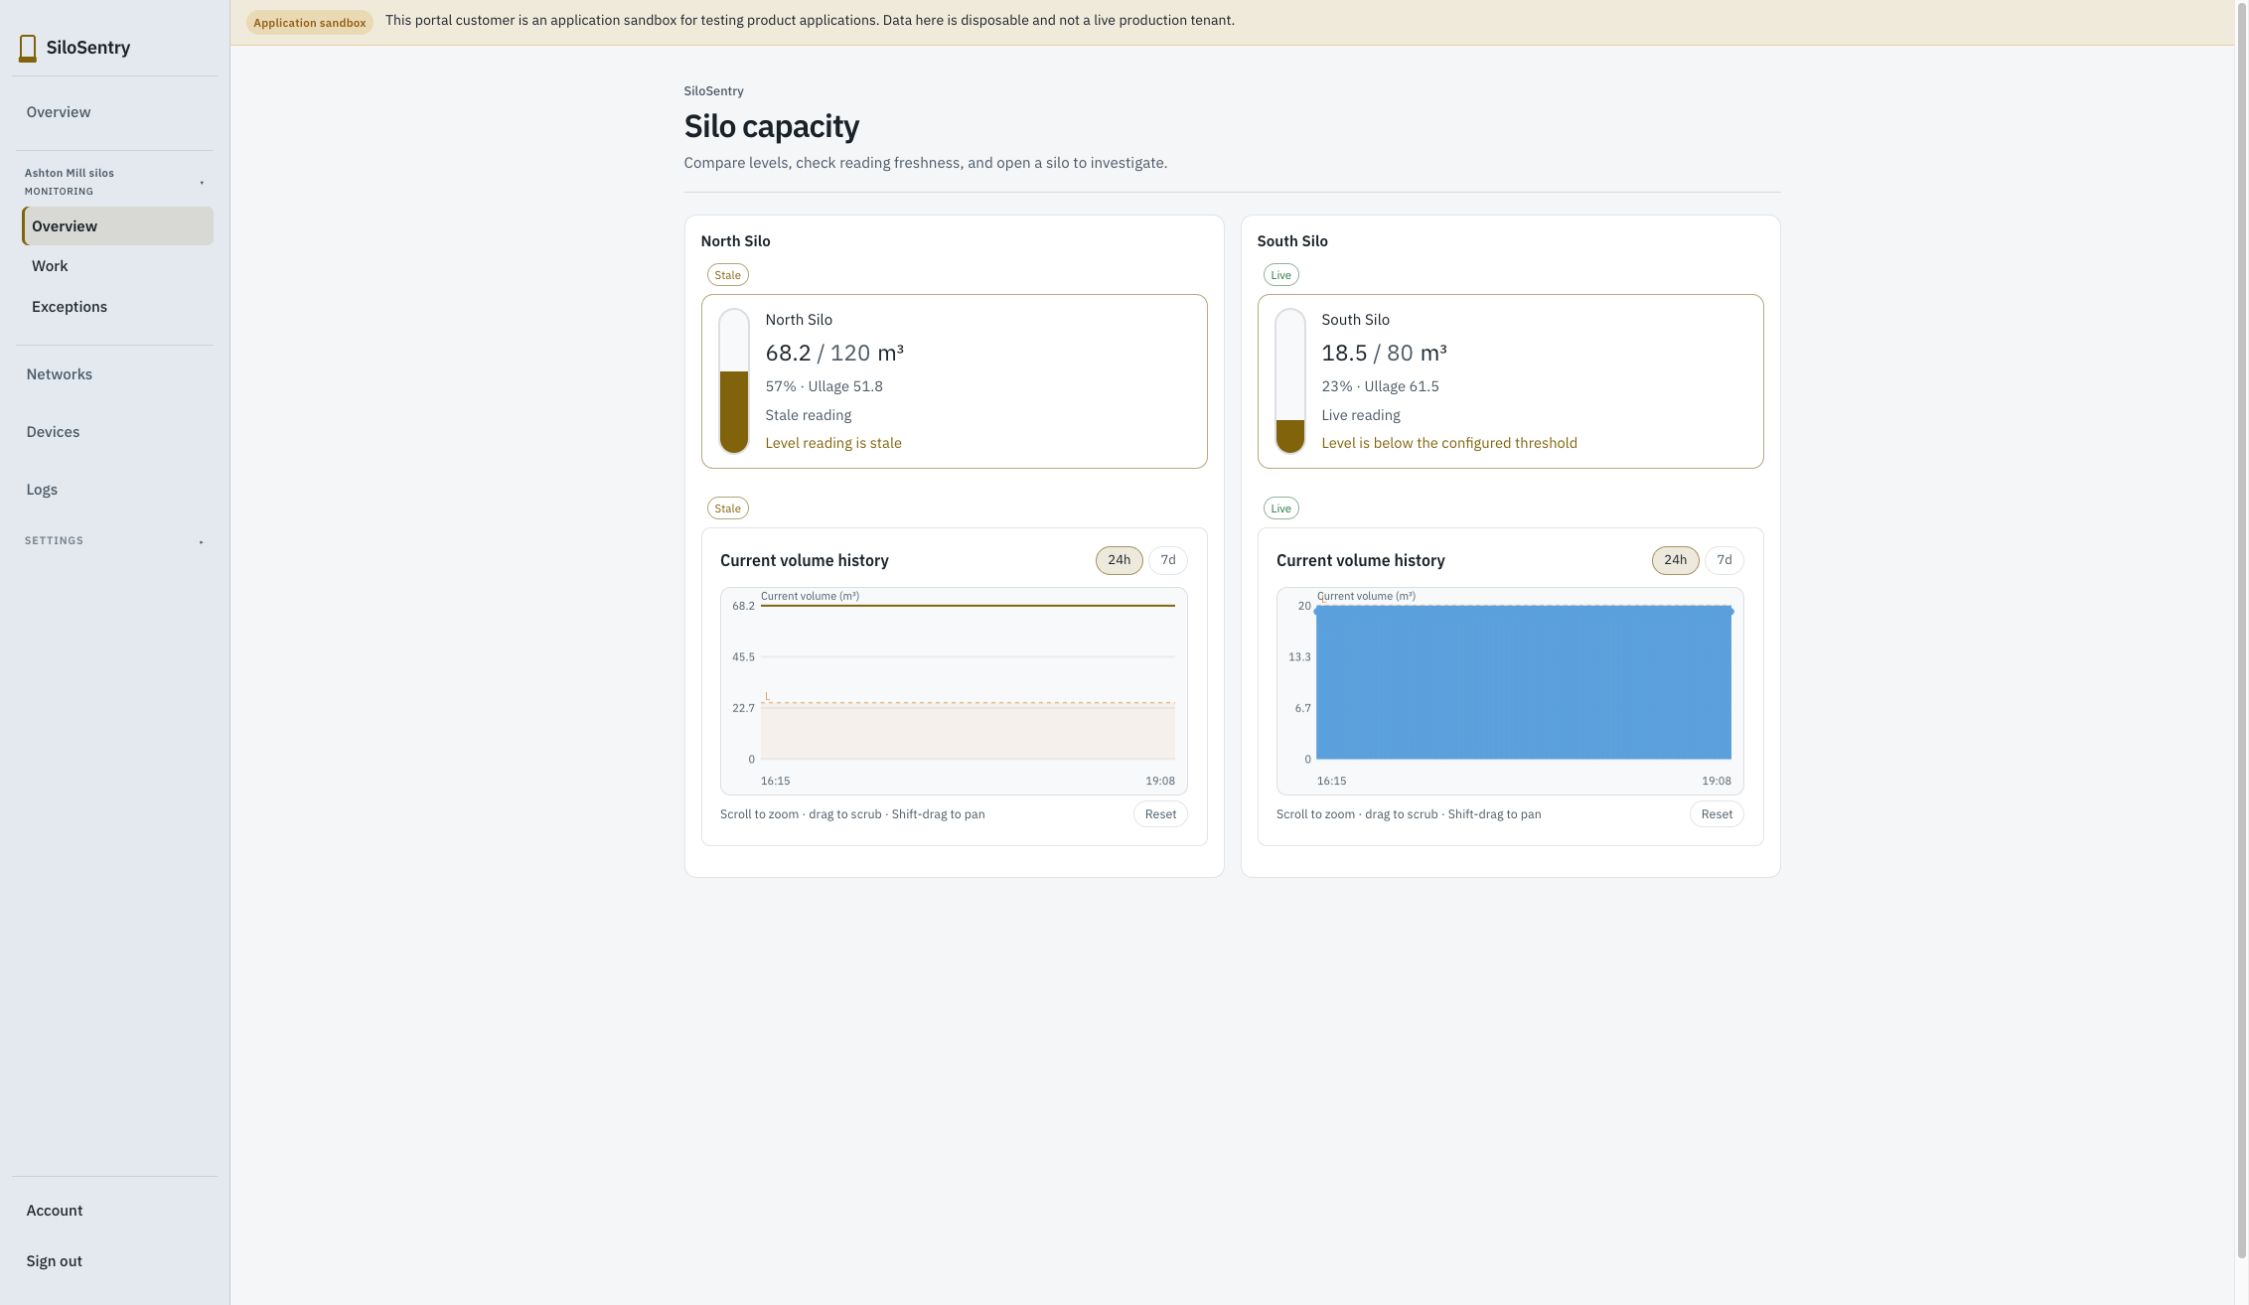
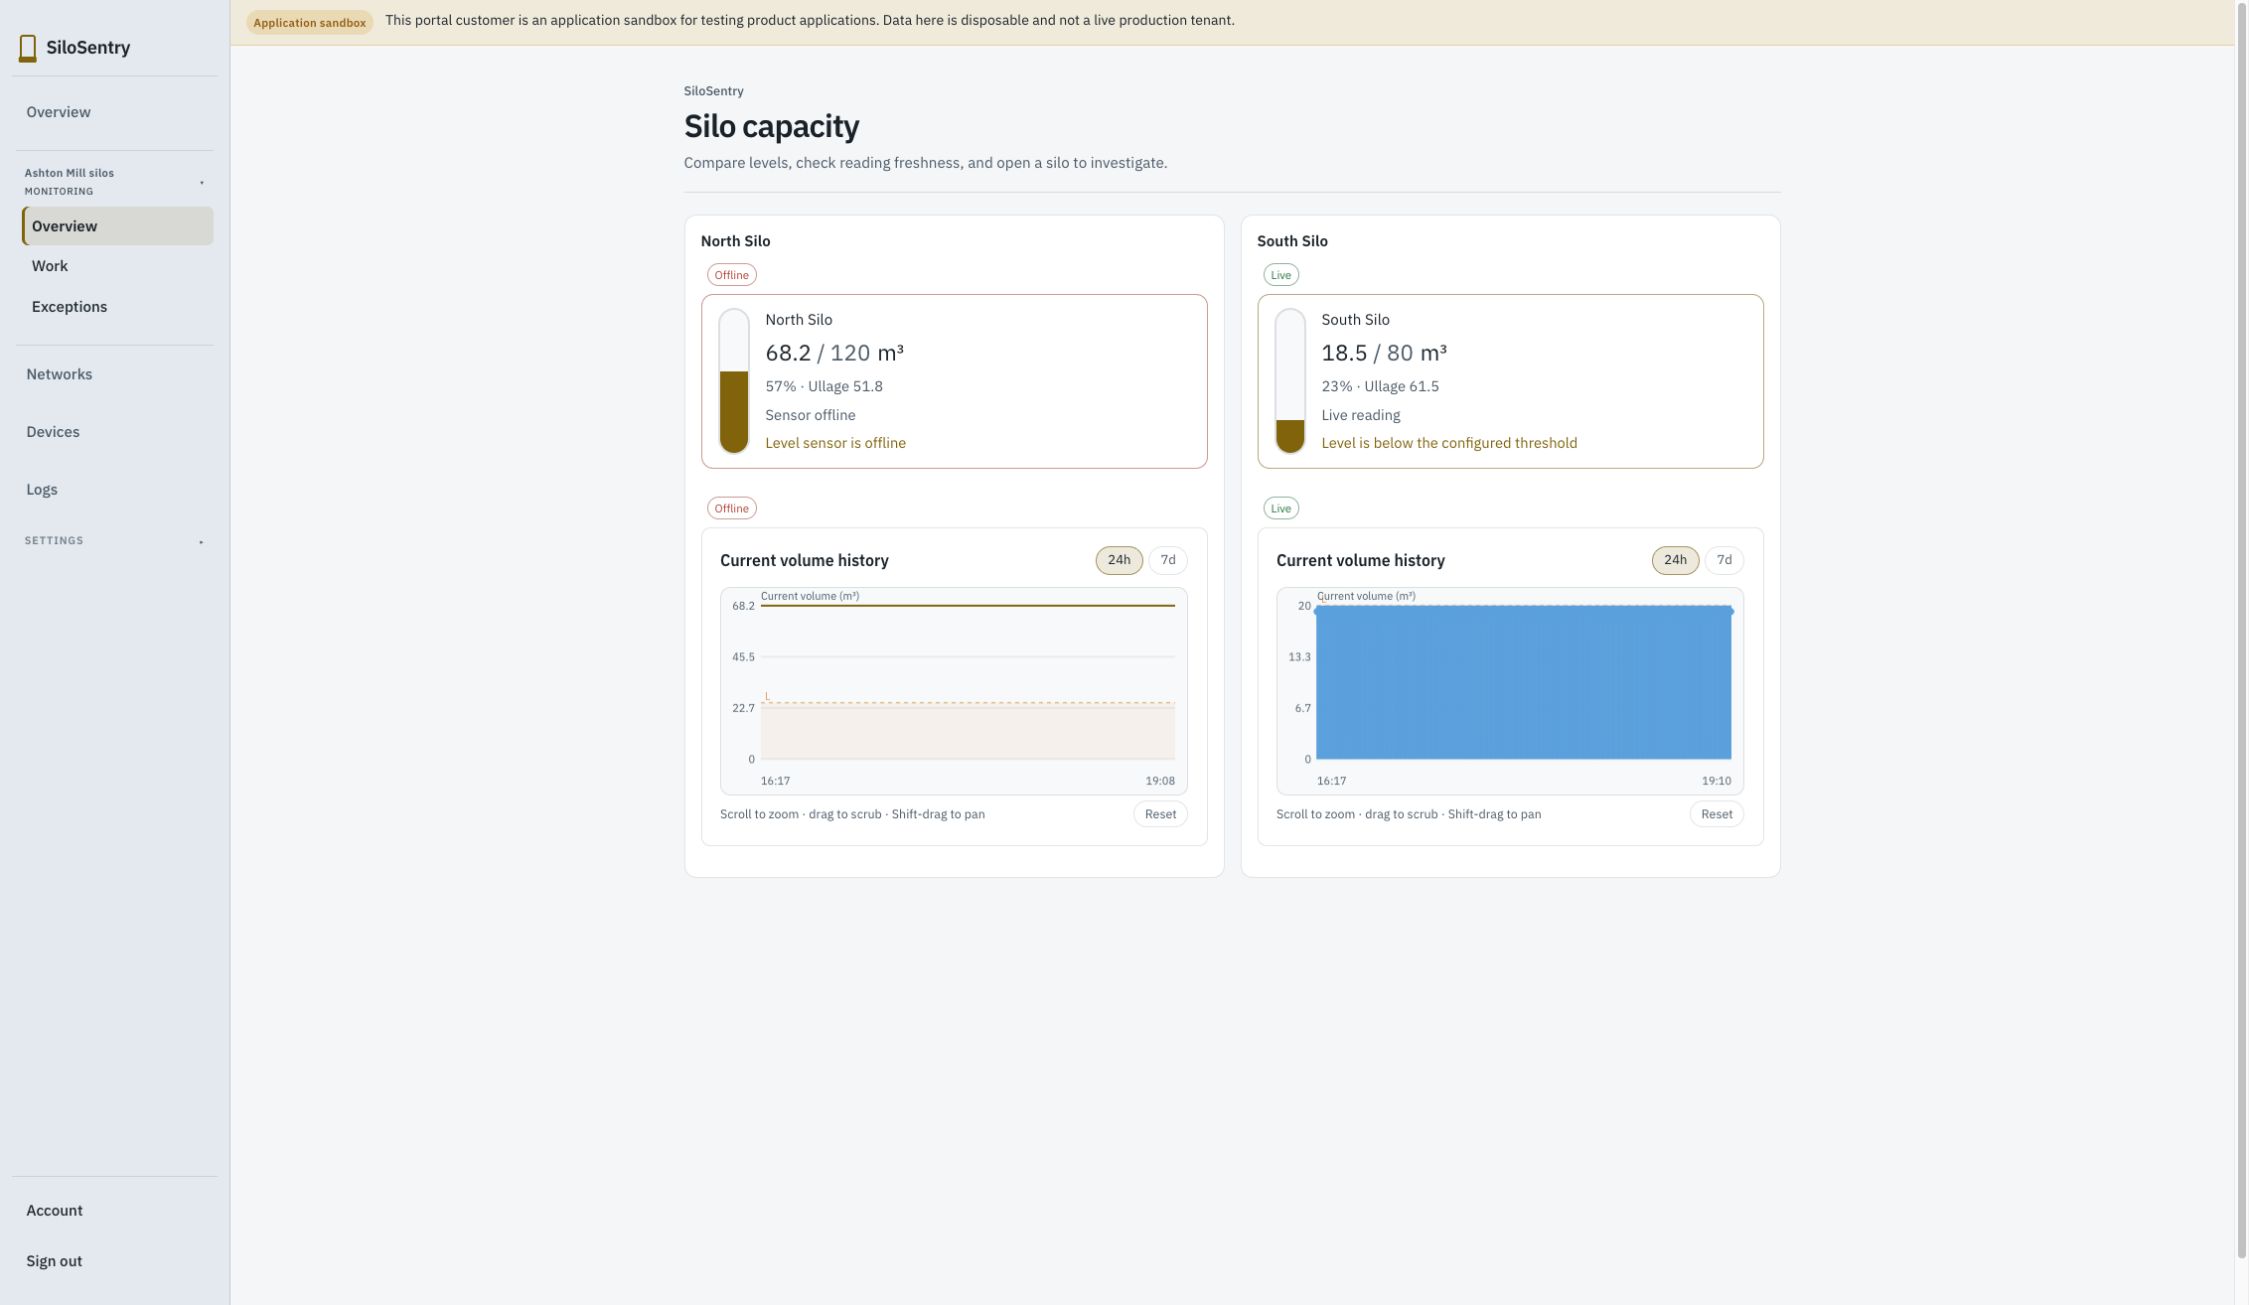
Captured from a running local Dataplicity reference application on 27–28 October 2026, using simulated equipment, sensor observations and heartbeats. These screens exercise application configuration, calibration, history, alerts and recovery. They do not establish physical sensor accuracy, a field deployment or a remotely repaired machine. The interactive customer illustration above is a simplified explanation of the same states.
SiloSentry, Alex, Sam, Jo and Ashton Mill are invented. The customer view, engineering brief, installation record and support exchange are authored examples. The Files and Messaging captures show those records in the actual product. The field fault and recovery are a worked scenario, not a captured customer incident. The walkthrough uses documented Dataplicity capabilities.
Dataplicity supplies equipment access, fleet tools, customer-application capabilities and team tools. The equipment maker brings the sensing system, product engineering, configuration and physical installation.
The linked guides explain implementation, plan limits and what your team must prepare. The example makes no claim about a real customer’s savings or results.
Start with a useful job for your team: work through an engineering question, connect a device, or plan the application your customers need.